Home
Grumman Airplane Performance
Except for two brief attempts at revival, the AA-5* airplanes are 35-40 years
old. So are their Owners' Manuals ("POH").
When those manuals were written, electronic calculators cost over $200, in
1970s dollars (over
$1000 in 2015) – an expensive addition to anyone's flight bag.
So the manuals have performance listed in tables that
help the pilot avoid having to
calculate density altitude. The information was
always there, just cloaked a little bit.
The charts here are based on
density altitude,
which is
easy to calculate these days. They are graphic, so that intermediate
values are available without the need to use that (now cheap) electronic
calculator for interpolation. They are derived directly from POH data. The
tables from the manual were simply entered into a spreadsheet and plotted.
Data are given for the airplane at maximum gross weight. For lighter
weights, performance is better in all parameters. Shorter takeoff and
landing distances, faster airspeeds, etc.
These charts were compiled from data for the 1972-79 series only. Data for
the 1990's and 2000's should not be substantially different.
For the Traveler, the POH takeoff and landing charts are so sparse that they are
not graphed here. It wouldn't be much of a graph.
One parameter that is not usually addressed is best range.
Melville Byington and
Russ Erb wrote articles on this topic over twenty years ago, and
David Rogers more recently, but their results still don't seem to be
widely used.
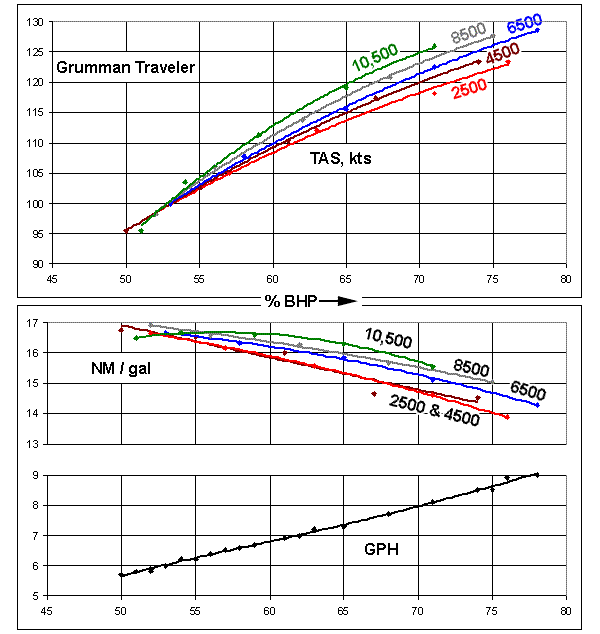
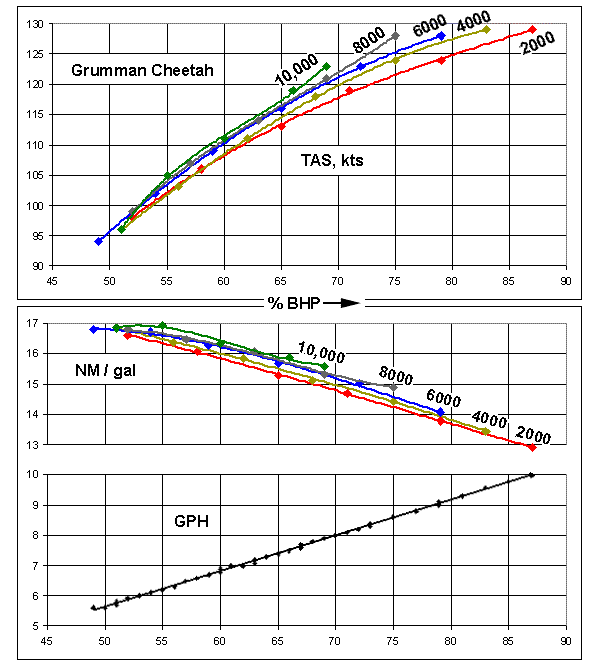
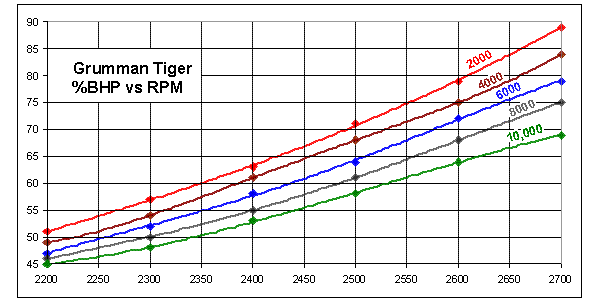
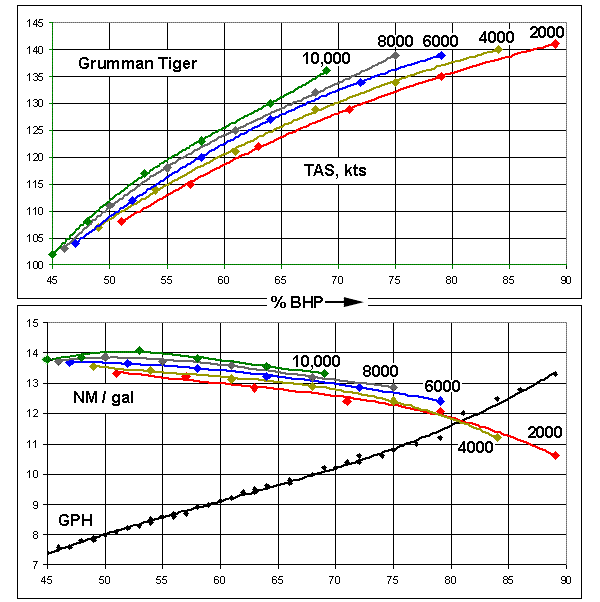
The manufacturer's tables give figures for airspeed (miles per hour) and fuel
burn (gallons per hour). It's a simple task to divide one number by the
other, so the charts include graphs for specific range (miles per gallon).
The curves peak at a power setting that's lower than we usually use to
cruise, but there isn't a lot of variation below 65% power.
Byington's article states that the
calibrated airspeed for maximum
specific range is independent of altitude.
Rogers makes the same point in his
excellent series on technical flying.
The manufacturer's data for the AA-5* series do not exactly agree with this
statement.
I have contacted a few "experts" about the discrepancy, but
nobody has come up with an explanation for it.
Maj. Russell E. Erb,
"A Low Cost Method for Generating Takeoff Ground Roll Charts from Flight Test Data,"
Society of Flight Test Engineers (SFTE) 27th Annual Symposium,
Fort Worth, Texas, November, 1966,
http://www.eaa1000.av.org/technicl/takeoff/topaper.htm
A Sample Atmosphere Table (US Units) http://www.pdas.com/e2.htm
Harvard Holmes, "Using a Spreadsheet to Construct a Takeoff Chart,"
Dec. 2002, http://www.eaa393.org/Cleco/Cleco03/to-m20e_3.htm
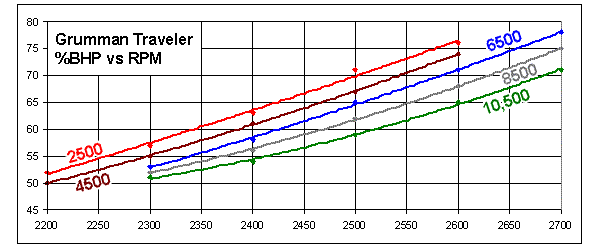
AA5 Traveler
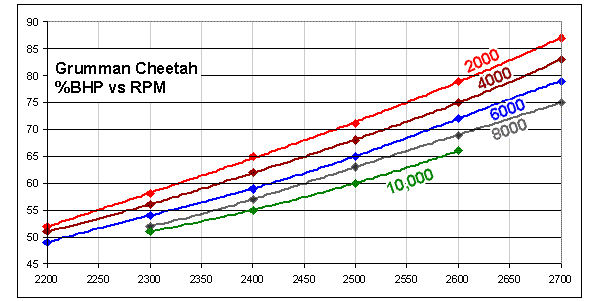
Cruise Performance
AA5A Cheetah
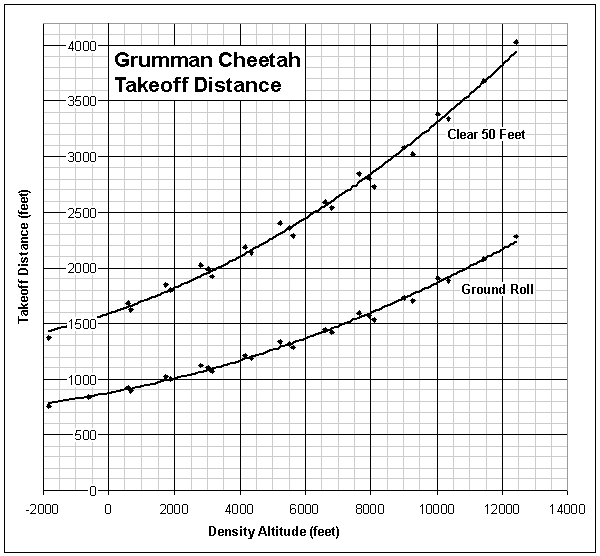
Takeoff Distance
Max. power, flaps up.
Runway: hard surface, level and dry.
Lift off: 56 KIAS
Clear 50 feet: 63 KIAS
Distances apply from the point where maximum power is attained.
Decrease by 4% for each 5 knots headwind.
Increase by 10% for each 2.5 knots tailwind, up to 10 knots.
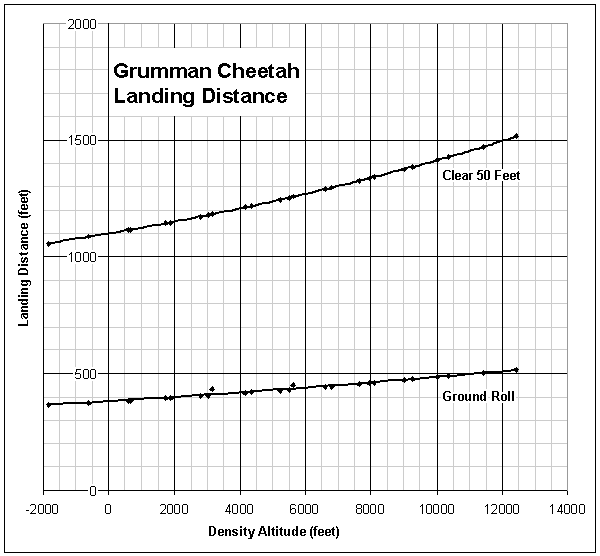
Landing Distance
61 KIAS at 50 feet, full flaps.
Decrease by 4% for each 5 knots headwind.
Increase by 9% for each 2.5 knots tailwind, up to 10 knots.
AA5B Tiger
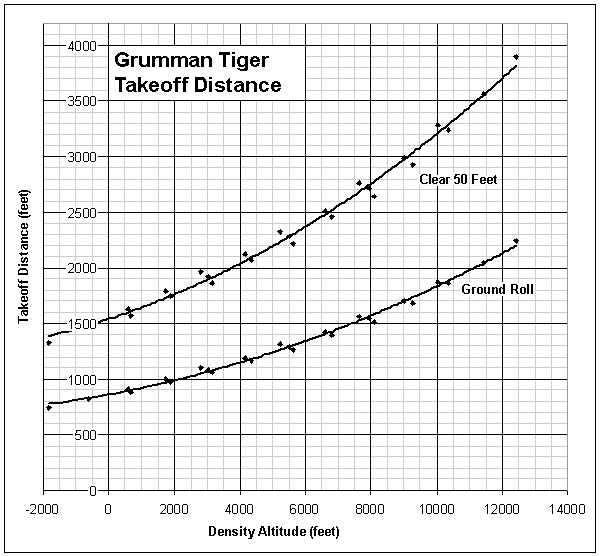
Takeoff Distance
Max. power, flaps up.
Runway: hard surface, level and dry.
Lift off: 57 KIAS
Clear 50 feet: 65 KIAS
Distances apply from the point where maximum power is attained.
Decrease by 4% for each 5 knots headwind.
Increase by 8% for each 2.5 knots tailwind, up to 10 knots.
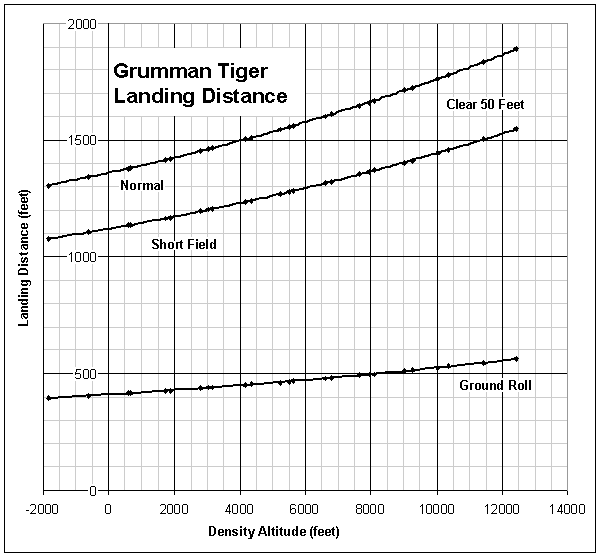
Landing Distance
Short field: 63 KIAS at 50 feet, full flaps.
Normal: 69 KIAS at 50 feet, full flaps.
Decrease by 3% for each 5 knots headwind.
Increase by 9% for each 2.5 knots tailwind, up to 10 knots.
