 Planning a Cross-Country Flight
 Planning a Cross-Country Flight
There are many things that inspire people to take up flying. One of the most obvious is to go places that are too far to drive, or can't be reached by car at all, like islands.
For some pilots, cross-country navigation is the part of training they look forward to. Others dread it. Here, a little understanding can go a long way. This article will take you through the planning for a cross-country flight, one step at a time. These are the steps you'll need to follow on your flight test. Despite what some grizzled airport bums tell you, the planning is useful in "real life," too. At the very least, you should understand what's going on.
This article's intended audience is the student pilot getting ready to start training for cross-country navigation. Many of the airport "greybeards" will tell you that you'll never need this material after your Private Pilot flight test. They're partly right, and they're mostly wrong. The principles of navigation have not changed since the dawn of time: if you can stay pointed in the right direction for the right length of time, you'll get to where you want to go. So the elements of navigation are the two apparently most primitive instruments in the airplane: the compass and the clock. Everything else, right down to the glitziest and most modern GPS / glass cockpit, are just support tools for those two most basic tools. The modern instruments certainly make the job a lot easier, but you should try to understand that they're only there to lighten the workload. If you turn your back on the two basic instruments behind it all, you're lost.
This article will walk you step by step through the process of planning and executing a cross-country flight. It's long because it needs to be. Don't try to read it in one sitting, or the information won't stay with you.

One of the most useful tools is also one of the most reviled: the navigation log. There are probably hundreds of variants in common use, each with its own strong and weak points. One of the more popular versions is by Dauntless. There are slightly different versions, tailored to different kinds of flight computer (another useful and hated tool). There are buttons at that link for free downloads.
This article uses a custom navigation log ( PDF 117K ) that was designed to simplify the process for student pilots. Most of these forms use a lot of real estate for items that are needed during planning, but not in flight. Our form separates those so that the right side only has information that's needed in flight. The form folds in half, to fit on most kneeboards.
All terminology on the custom navigation log is standard, so it should be easy to adapt this article for whatever form you choose. You will find yourself jumping around a bit, because most of those forms are not laid out in the order you'll use while working with them.
You need to know how to complete and file a flight plan. For the past few years, the FAA has been promoting a move away from the simple form they've used since time immemorial, switching to the ICAO format used in most countries outside the U.S. For planning purposes, there's no significant difference in the workload of the ICAO form ( PDF 25K ) for most general aviation pilots. We'll cover the new order of things, in due course.
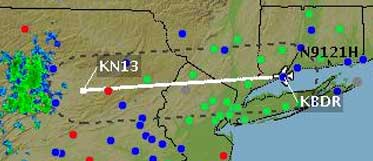
We'll work through the planning for a flight from Bridgeport, Connecticut (KBDR), to Bloomsburg, Pennsylvania (N13). This is an orderly process, which is easy to accomplish with a simple checklist. In this article, we'll cover every step in that checklist, but in a slightly different sequence. That's because some steps can be done independently, before complete weather information is available for the trip. This is useful if you want to plan a trip that won't happen for a few days. You can do a lot of the planning well ahead of time, and only need a bit of work to complete it when a forecast is available shortly before the flight actually happens.
This trip isn't a typical student cross-country flight. It's quite a bit longer. That allows some concepts to be illustrated easier, like discarding the notion that you must draw a straight line from Point A to Point B and never deviate from it.
Most of the illustrations in this article are too large to display inline, so they're represented by thumbnails. Click on the thumbnail and the full size picture will pop up in a new window. Obviously, this feature will be frustrated if you use a popup blocker, so this would be a good time to change that setting, at least for this page.
We use at least four words for directions, referred to North. Many pilots get some of them confused, either in concept or just in conversation. They're important, so let's settle the difference right away.
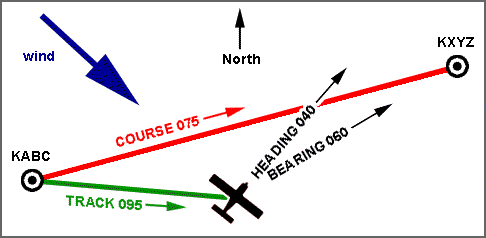
The words are course, track, heading, and bearing. If there is no wind and the pilot flies his line perfectly, they all coincide. If there is any wind, the pilot must correct for it, usually imperfectly at first. So the illustration shows a plane whose pilot is trying to compensate for the wind, but is blown off course a bit. The angles are grossly exaggerated to make the explanation clearer. Our pilot is trying to fly a straight line from airport ABC to another airport, XYZ.
Except for heading, these words are all used in GPS units. Those units are much easier to use well if you understand the language.
You can do a lot of planning without detailed knowledge of the weather, if you assume if will be VFR. The goal is to complete a large part of the right side of the navigation log.
For this trip, we'll assume that we can fly at 4500 feet ASL. This will provide a reasonable clearance over terrain, and it satisfies 14 CFR 91.159: — above 3000 AGL, we're required to cruise westbound at even thousands +500.
The principles are the same whether we use paper charts or electronic resources like Foreflight or SkyVector. We'll consider both modern and "dinosaur" techniques.
 Although it doesn't apply to this route, this is a good time to consider the
problem of a route that uses the north and south sides of the same chart.
Every sectional chart includes comprehensive instructions in the margin,
explaining how to use a spare piece of paper to work out where the line
should be drawn. Very few pilots seem to know about this, and fewer still
understand it. The best piece of paper for this job is another chart.
Lay the charts down together, line them up, and draw part of your line on the
chart you'll be using. Then turn them over and repeat, making sure to draw
on the correct chart. Of course, if the route covers more than one sectional
chart, the technique is obvious. Just align the charts and draw your line on
each one.
Start by simply drawing a line between origin and destination. On paper, it will look like this (click the map, it's a big thumbnail). A red pencil line is much easier to see than a black one, but most pilots use the first pencil they grab. SkyVector, Foreflight, and the others all handle this problem automatically.
If you're using SkyVector, it looks like this.
That direct line runs very close to New York's class B airspace. Rather than worry about airspace and clearances, let's put a small dogleg into the plan. This adds 0.2 nautical miles to the total length. In other words, it adds a bit of comfort for negligible added in-flight cost. It also gives us a waypoint that's almost impossible to miss.
Here's what you'll see on SkyVector after using its "rubber-band" feature. On a longer trip, you might use this feature more than once to make your route easier. Airspace isn't the only thing we tend to fly around. Sometimes a dogleg will keep the route away from unfriendly terrain like mountains or large, densely populated cities.
 That single bump in the road is all you'll need for this trip, so next
measure the courses for its two segments. The best instrument for this
job is also the simplest: a small circular protractor. You might have to
look around to find one, but it's worth the hunt. The one illustrated is
about four inches in diameter. Sectional charts are folded five inches
across, so a good storage spot suggests itself.
 In Canada and Europe, the Douglas protractor (left) is popular. This is
basically a squared-off version of the first one, and a bit larger (5"
square). It includes markings at sectional scale (1:500,000).
 Flight schools in the U.S. seem to prefer the combination plotter shown in
the thumbnail at right. I don't know why this thing is so popular. There
are at least four ways you might lay it on the chart to measure your course,
and three of them will give the wrong answer. But you can learn to live with
it if you're careful.
I have a few of them. I cut off the protractor part and use the mileage
scales.
Here's the drill: lay the plotter on the chart so that
Meridians are the vertical quadrangle lines, the ones that connect the North and South Poles. Now, read the course at the top of the plotter where it lines up with the meridian. Note two things:
In our case, we have to choose between 092 and 272. It's a westbound course, so the first segment is 272, which is referred to True North. There's still a correction to be made for local magnetic variation, but we'll deal with that later.
The previous paragraph referred to a course as 092, not just "92." It's customary to refer to all compass measurements — heading, bearing, course, track — with three digits, even if the first one or two digits are zero. North is 360, not 000.
It's not enough to use waypoints only at the beginning and end of a trip. You might know you're 50 miles west of Bridgeport, or that you have another 70 miles to Bloomsburg, but if something unexpected happens you will want to know where you are right now. For longer trips, you will also do some calculation early on that might let you extend the distance to a fuel stop, or even eliminate a fuel stop altogether. Because a fuel stop usually adds at least an hour to a multi-leg trip, knowing it's safe to skip one can be a big help.
I refer to the part between waypoints as a route segment. On a longer trip with one or more stops, most pilots refer to the part from takeoff to landing as a leg.
Distance between waypoints varies based on weather, groundspeed, and other factors. For this trip, we'll plan the waypoints so that we know exactly where we are, every ten or fifteen minutes. This should be good enough to make an early estimate of when we'll ultimately be landing (the groundspeed check), and to lend confidence for reroutes and diversions. The waypoints are mainly used for timing, but if they also establish our lateral position it's icing on the cake. Regardless of how we choose the waypoints, we'll be looking for "fences" to help us avoid drifting off-course. If the waypoint itself serves that purpose, so much the better. If that's not practical, look for things like rivers and highways off to the sides, and resolve not to cross them without good reason.
For each waypoint, make a big enough mark on the chart that you won't miss it in a noisy, vibrating environment while you're moving two miles a minute and trying to pay attention to everything. SkyVector and Foreflight will take care of that for you. When you mark your waypoints in those programs, be careful not to rubber-band the course line unless you want to.
The first waypoint is obvious: KBDR, the origin airport. It's already on the chart, at one end of our (for now) two-segment course line. Write its name on the navigation log as the first waypoint.
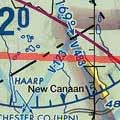 There is a reservoir about halfway from Bridgeport to the Hudson River. It's
a good waypoint, but the chart's designation for the airway V123 mostly
obscures it. We'll use it anyway, mostly because its size and shape make it
unlikely that we'll confuse it with anything else. On the navigation
log, it will be enough to call it reservoir.
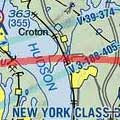 Croton Point (right), the second waypoint, was chosen for us when we decided
to put a dogleg in our course to keep clear of New York's terminal airspace.
Make a distance mark on the chart and add Croton Point as to the
waypoints on the nav log.
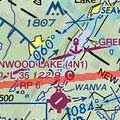 Airports are good landmarks, and Greenwood Lake is no exception. Even in the
unlikely event that we don't see the runway, its namesake lake is easy to
see and identify.
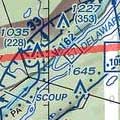 Crossing the Delaware River (right) into Pennsylvania, our route goes near a
distinctive S-turn. This is great for timing and for lateral
guidance; obviously, we'll add Delaware River to the navigation log.
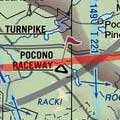 Racetracks don't always stand out, but the Pocono Raceway is big and
prominent enough to qualify as a charted VFR Waypoint — that's the
significance of the underlined name and the pennant on the chart. Air
traffic controllers working this area are required to know about these
places, allowing us to give accurate position reports if we're using
radar advisory services.
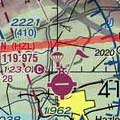 Our last waypoint before the destination airport will be I-81, the four-lane
highway passing by the Hazleton airport. Add its name to the log. I've
called it I-81, but 4-lane or Hazleton would do as well.
Finally, add the destination, Bloomsburg, as the last waypoint. Now we'll start measuring distances.
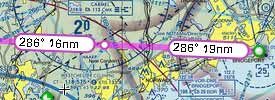 If you're using SkyVector, your distances are already measured, as a byproduct
of marking the waypoints. All you need to do is copy the distances from there
onto the navigation log.
If you're using purely paper, measure the segments with an appropriate mileage scale. The most convenient one is probably on your plotter. Be sure to use the correct scale! Use nautical miles, not statute miles; and use the Sectional (1:500,000) scale. If you use the WAC scale by mistake, your measurements will all be off by a factor of two.

 If you're really old-school (or a die-hard sailor), you can use
dividers to measure distances on the chart.
If you do this in the airplane, be careful not to stick yourself.
The definition of a nautical
mile is one minute of arc, measured along a meridian line. Each tick
on a meridian line is a nautical mile; the 30-minute quadrangle lines are 30
nautical miles apart. Don't measure along the parallels! These are
the lines that run east and west on the chart. Their divisions get
smaller as the chart area moves from the Equator to the poles.
If the meridians are hard to read in your active area, there's a scale at the bottom of every sectional chart. It's in the margin, just above the listings for special-use airspace.
![]()
Get used to it. You'll see scales like this again, when you take the FAA knowledge test.
If you're using SkyVector, add the numbers on your navigation log anyway. The sum should agree with the total in the Flight Plan layer, within one mile. On paper, measure the route from end to end and compare it to your total. This should also agree within a mile.
distance remaining is zero at the destination. Working up the column, list cumulative distance remaining by adding the segment distances. distance remaining at the point of departure (first waypoint) must be identical to the total at the bottom of the distance column.
If you know your groundspeed, you can use these numbers to compute an estimated time to arrive at Bloomsburg, each time you cross a waypoint. You will be using this information at least once, early in the trip when you do a groundspeed check. If your passengers are easily bored, you might use it at every waypoint. (They would have to be very bored.)
Here, we need to jump ahead a little bit. When we have a forecast available for winds aloft, we'll use that information to estimate groundspeeds over the route. Obviously, there will be two calculations because of the slight bend at Croton Point. There will also be a third calculation because of the distance between certain weather stations. For part of the route we will use forecasts for Kennedy (JFK), and for another part we'll use Wilkes-Barre (AVP) data.
 Mark up the headers for these three segment groups on the left side of the
navigation log. The earlier illustration showed that the true course from
BDR to Croton Point is 272. A similar measurement shows that the true course
is 265 from Croton Point to Bloomsburg.
Read the magnetic variation from the sectional chart and enter it on the navigation log, in both places. Add this to true course, and enter the magnetic course for each segment. The left side of the navigation log should now look like the illustration. We're done with this part until we have a weather forecast.
In an effort to keep things organized, this article uses color codes on the navigation log illustrations. Items written initially are in blue. Later, items that will be added after you get a weather briefing are shown in green. Finally, items that are added in flight are red.
If you're using SkyVector, note that the courses displayed are magnetic, not true. So you don't need to calculate them, just enter them in the mc row. Depending on what tool you use later to calculate wind correction, you may still need true courses. You can get these from SkyVector's navigation log. On the Flight Plan layer, click the Nav Log button, and read the true courses from the Track column in the navigation log that pops up.
Your chart should look about like this, with one small exception. We'll cover the "start descent" notation soon enough. Here's the SkyVector version. You probably won't mark the segment distances on your paper chart, either. They're just included for completeness. The image that you get from this link is very wide. Use the slider at the bottom of the frame to see all of it.
You should do a map study before launching. If the weather doesn't follow the forecast, or if you fly through an area that doesn't have a forecast, you may find yourself descending to avoid clouds. How low should you go? It's worth your time to study the area within a few miles either side of your course, including a few miles beyond your destination. First, a bit of armchair navigation. Learn how big your hands are, on sectional scale. Your finger is probably about the right width to cover five nautical miles on the chart. So push a finger along each side of your course line and notice what it covers. Make a note of any interesting terrain or obstacles and circle them on the chart. Remember to look "one finger" or more past your destination, so you know there's no danger of bumping into something if you overshoot it before you see it.
One of the most common mistakes private pilots make is not planning their arrival at the destination airport. After cruising along — oftentimes bored stiff — for two or three hours, our hero arrives at his destination, realizing suddenly that it's several thousand feet straight down. This is embarrassing, and completely avoidable.
When I ask pilots about descent planning, they usually answer with a complex plan involving 500-FPM descents and arriving at pattern altitude a set distance from their destination. Then we go flying, and they don't do any of that. The math behind all of those schemes is too complicated anyway, even if those pilots paid it more than just lip service.
The method presented here works well for airplanes that cruise in the range of 100-130 knots. It's based on the same principle that makes ILS approaches work. Imagine that you had a VASI available at an arbitrary distance. Wouldn't it make sense to follow it down to your destination? Here's how to have the same advantage, with minimal planning.
As if on a VASI, we would like to descend to our runway on a constant glide path. For our fairly slow planes, a 300-ft/NM descent requires only moderate descent rates — no worries about popping your passengers' ears. Just as all VASI and ILS are on the ground, we will calculate our descent to field elevation, not to pattern altitude. When you see the airport, it will be natural to continue the descent and land, or to join the landing pattern at the right height. On this glide path, you will reach pattern altitude just over three miles from the airport, leaving plenty of time to slow down for a graceful landing, even if it's straight in.
We've planned to cruise at 4500 feet, and the airport is 481 feet above sea level. Dividing this altitude to lose (about 4000 feet) by 300 ft/NM, we see that our descent must begin 13½ miles from the destination. Mark the chart as a reminder for top of descent.

This scheme identifies only two points, the top of descent and the point of landing. How do you stay on a constant glide path? Until the airport is in sight, the best way is to use the same technique that keeps an instrument pilot on the ILS glide path: adjust the descent rate for ground speed. This is easy — adjust the vertical rate to be exactly five times the ground speed, which is usually available on DME or GPS in the cockpit. (If you want to see the math, the derivation is in the notes[1]. There are no approximations. Exactly 5 × GS does the trick.) Before long, either you'll see the airport and proceed visually, or realize that you need to level off early and find the airport from overhead.
One more time: don't even think about pattern altitude until you get there. If you're on a good glide path, you'll reach TPA over three miles from the runway. Even on a straight-in approach, that leaves plenty of time to slow down to final approach speed without any dramatic maneuvers. For any other approach, the setup is even easier. For a downwind entry, simply level off at TPA and let the airplane decelerate gradually. By the time you turn downwind, you've had plenty of time to get slowed and configured for your approach to landing.
It's time to take a look at the Airport / Facility Directory [2], a most useful document that is updated every eight weeks. The entries for our departure and destination airports are reproduced below. You might find it useful to skip just past the second one, and refer back as needed.
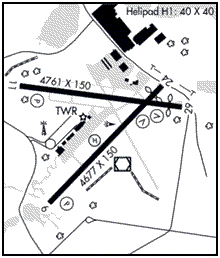
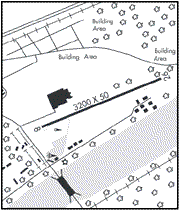
The AFD has a wealth of information about each airport listed, but a lot of it is heavily abbreviated. Field elevation is always the first entry on the second line of each airport's listing. Looking there, we see that Bloomsburg is 481 feet above sea level. Farther along this line, we find the entry "TPA–1581(1100)." The numbers represent an altitude and a height in a format that's standard across FAA documents. The first number, 1581, is an altitude, feet above mean sea level (ASL or MSL). The second number (1100) is a height above ground level (AGL). Traffic Pattern Altitude at Bloomsburg is 1581 feet ASL, or (1100) feet above the runway. This same format is used for obstacles on the chart. In the words of a prolific aviation educator, "the first number is what will be on your altimeter when you hit it. The second number is how far you'll fall before you crash."
On the right side of the navigation log, write the number 481 in the slot for destination elevation, and 1581 for pattern altitude.
In the AFD listing for Bridgeport, this field says, TPA - See Remarks. This is where it can get complicated. Reading through the remarks, we find the information that pattern altitude at this airport is different for different kinds of aircraft. Nothing special here, they're just clarifying what should be obvious.
If the "TPA" entry is missing from the second line, it means that traffic pattern altitudes are "standard." For the light singles we're using in this article, that always means 1000 feet above field elevation. For multi-engine airplanes and singles that weigh a lot, it means 1500 feet AGL.
When you finally get to the destination, you may want a road map of sorts. But first you need to find the place. Take another look at the first line in the AFD entry, where it says "0 E." This useful tidbit is often overlooked. It's where the airport is located, with reference to its home town. In this case, there's virtually no distance; the airport is directly east of town. More typically, you'll find an entry like "3 SE" in the listing for Bridgeport. Not a problem for this big municipal airport, but it can be useful for some smaller strips. A lot of them have a way of blending into the landscape. After flying the perfect trip, you know you're right there but can't seem to find the runway. But you can almost always spot the nearby town. Do that, and look in the direction given by the AFD. Now you've just turned a 150-mile cross-country trip into a 3-mile search. Stay within that little radius and you'll find your airport before you know it. This number is so useful that it belongs on your navigation log. Enter "0 E" in the block where you wrote the name of the destination airport.
 Now, about that sketch. Larger airports like Bridgeport, including most
airports with control towers, have a
taxi diagram in the last section of the Airport / Facility
Directory. This is the best thing. Just print it, copy it, or tear it out
of the book, and you won't get lost on the ground.
Lacking a full-scale taxi diagram, most AFD entries now include a
small sketch of the airport layout. Lacking that, you may be able to
find a charted instrument approach for the airport. That will have a layout
diagram. Copy the layout onto your nav log to help you stay oriented after
you land. Add a small arrow to indicate your approach direction. This will
help you visualize the runway as it will appear in flight. If the airport is
very simple, there won't even be a layout in the AFD. Make one up from
the runway information provided, and sketch it on the nav log.
If one or more runways uses right traffic, add a note to your airport sketch. It could be as simple as drawing a little clockwise arrow in the right place. Find the information in the AFD entry. If a runway normally uses right traffic, its entry line will end with "Rgt tfc." There will also be a notation like "RP 29" in the airport data block on the sectional chart. rp means "right patterns."
At Bridgeport, the first thing you'll do is listen to the ATIS — probably before starting the engine. (On most rental planes, the Hobbs meter doesn't count up without oil pressure from the running engine.) Then, call Ground for taxi, followed by some checklist tasks and a call to Tower for takeoff. These are the first three frequencies in the last column of the navigation log.
If you filed a flight plan but didn't activate it with one of the email or text features, you'll need to call Flight Service on the radio shortly after takeoff. The frequency for that is shown in the AFD entry for Bridgeport as one of the RCO (remote communications outlet) frequencies. Note the frequency 122.2 in the navigation log.
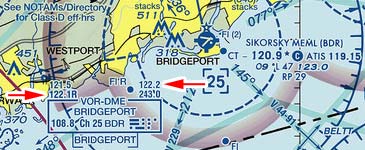 There's more than one way to skin a cat. The
AFD entry and the sectional chart both show several ways to communicate
with Flight Services near Bridgeport. The VOR box on the chart indicates this
capability in two ways: the name of the responsible facility is outlined
below the box, and several frequencies are shown above it.
121.5 and 243.0 are emergency frequencies; we don't use these to open a
flight plan. 122.2 is the standard simplex frequency, which is available at
Bridgeport. What about "122.1R?"
This is a duplex frequency, a holdover from another era in aviation. It's possible to talk to Bridgeport Radio (the facility named below the VOR box) by transmitting on the COM radio and receiving on the VOR. The chart hints at this, and the AFD entry makes it explicit (1221.R, 108.8T). The Flight Service Station can receive on 122.1 and transmit on the VOR frequency 108.8. To use this channel, we need to turn on the VOR audio in the cockpit, tune the VOR to 108.8, and turn off the ID function on the VOR. Then we transmit on 122.1, a COM frequency. On initial callup, mention the setup: "Bridgeport Radio, N16020, receiving 108.8."
 Finally, you might want to use radar advisory services ("flight following")
for this flight. For that purpose, you'll call New York Approach on the
frequency listed in the
AFD entry, 124.075. (Look for the ® symbol.)
Most radios show only two digits after the decimal
point, so it's customary to write this frequency as 124.07, and
also to speak it that way. When this country starts using COM frequencies
with 8.33-kHz spacing, as they do in Europe, our conventions will probably
have to change.
Anticipating handoffs in flight following, leave some space in the FREQ column to write the new sector frequencies.
There's some radio work needed at the destination as well. Bloomsburg doesn't have a control tower, so write the Common Traffic Advisory Frequency (CTAF), 122.8. If they had weather equipment there, you'd write that frequency as well. They don't, so it will be helpful to use the AWOS frequency at nearby Hazleton airport (119.975), which will give us a local altimeter setting and a suggestion about surface winds in the area.
At this point, you've done as much as you can without getting a proper weather briefing. The right side of the navigation log will look like the figure in this section. When you know the forecast wind and some other details, you'll be able to finish planning this trip.
In most of the contiguous 48 states, a VFR flight plan is something of an anachronism. The stated purpose of a flight plan is to trigger a search if a flight doesn't end according to plan, but this requires several things to happen, each with a built-in delay. The result is that you might come to grief early in your trip, and nobody would even start to look for you until several hours have passed. Why not use radar advisory service, and bask in the comfort of knowing you're always talking to somebody who can alert an emergency crew right away, and who knows exactly where you are?
There are still parts of the U.S. with poor radar coverage. There, the VFR flight plan is still useful. You will need to demonstrate a working knowledge about it on your practical test. Even in parts of the eastern metroplex, we sometimes need an active flight plan because of Homeland Security rules. So there are still some reasons to become familiar with this tool and how to use it.
As already noted, the long-familiar FAA flight plan will soon become a thing of the past. The ICAO format has been accepted for all flight plans since 2015, and it will eventually become the only accepted format [3]. So let's get familiar with the ICAO flight plan and how to use it. Operationally, the learning curve for domesic flights is not steep, except for some IFR GPS procedures that are beyond the scope of this article. You will file the flight plan in one of a few well-understood ways.
Either you let the briefer handle the complexities, or you put up with it only once, for the web-based services. After the initial setup, everything runs smoothly.
Several elements of the flight plan are known, even without a weather briefing and the planning that will follow it. The numbers in the list refer to block ID numbers on the ICAO form.
Block #19 includes a lot of information, most of which you enter once and
forget it for web services. Most of it is also assumed by the briefer for
U.S. pilots. You should file for the actual amount of fuel that will be in
the tanks when you take off, not just the legally required minimum. That
way, if you don't turn up at the expected time, searchers will know your true
radius of operation. If you file for a smaller amount of fuel, they won't
look as far as you might be able to fly.
Unlike with the old form, you should be asked what kind of ELT you have, and
there are questions about onboard survival equipment. Again, this is a
one-time thing for online services.
You should file the name and phone number of an emergency contact.
Except for departure time (block #13) and time enroute (#16), that's it. You might also change the airspeed and cruising altitude after you get a look at the weather, but the flight plan is mostly complete for now.
14 CFR 91.103 requires the pilot to "become familiar with all available information concerning [the] flight." Weather reports and forecasts are part of a substantial list of that required information. As careful pilots, we'd like to know anyway. So we get a weather briefing, either on the telephone or via one of many online sources. The Flight Service specialists call these briefings "products," and there are three kinds of them:
The standard briefing is in a fixed format. It is always delivered in the same order:
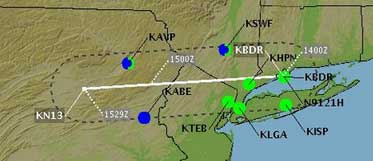
We'll use a representative briefing for this trip. It includes date codes for a flight on the 5th of the month, departing about 1200Z ("zulu" time). The full briefing is a very long document. An abbreviated version follows directly. The native format has several codes, many of which will be examined after the box below. This article continues after the briefing, here.
    ********  Adverse Cond / AIRMETs  ********
BOSS WA 050845
AIRMET SIERRA UPDT 1 FOR IFR AND MTN OBSCN VALID UNTIL 051500
.
.
BOST WA 050845
AIRMET TANGO UPDT 1 FOR TURB STG WNDS AND LLWS VALID UNTIL 051500
.
AIRMET TURB...NY NJ PA OH LE WV MD DC DE VA AND CSTL WTRS
FROM 30N ERI TO 100SSE HTO TO 60SSE SIE TO 50ESE AIR TO FWA TO
DXO TO 30N ERI
MOD TURB BTN FL240 AND FL370. CONDS DVLPG 09-12Z. CONDS CONTG
BYD 15Z THRU 21Z.
.
AIRMET TURB...ME NH VT MA RI CT NY NJ PA OH LE WV MD DE AND CSTL
WTRS
FROM 70SE YQB TO 40SSE BGR TO 20SE ACK TO 20SW CYN TO 20S AIR TO
FWA TO DXO TO 40WSW BUF TO 50SSW SYR TO 20NE MSS TO YSC TO 70SE
YQB
MOD TURB BLW 100. CONDS DVLPG 09-12Z. CONDS CONTG BYD 15Z THRU
21Z.
LLWS: Low Level Wind Shear
LLWS POTENTIAL...PA OH LE WV
BOUNDED BY DXO-SLT-20WNW HAR-30SSW JST-20NNW APE-40SSE FWA-FWA-
DXO
LLWS EXP. CONDS ENDG 12-15Z.
.
OTLK VALID 1500-2100Z
AREA 1...TURB CT NY LO NJ PA OH LE WV MD DC DE VA AND CSTL WTRS
BOUNDED BY 50NNE BUF-180S ACK-160SE SIE-20SE DCA-FWA-DXO-50NNE
BUF
MOD TURB BTN FL240 AND FL370. CONDS CONTG THRU 21Z.
.
AREA 2...TURB ME NH VT MA RI CT NY NJ PA OH LE WV MD DE VA AND
CSTL WTRS
BOUNDED BY 70NW PQI-60NE PQI-150ESE ACK-90ESE SIE-20S AIR-FWA-
DXO-30ESE SYR-20ESE MSS-YSC-70NW PQI
MOD TURB BLW 100. CONDS CONTG THRU 21Z.

    ********  Synopsis / Surface Analysis  ********

The briefing provides a link to the current Surface Analysis chart.
Surface Observations are organized in the same order as ATIS broadcasts. See text below this block for further explanation.
    ********  Surface Observations  ********
METAR Text:
VFR   KBDL 051151Z      24009KT 10SM FEW040 03/M03 A3015
VFR   KMMK 051153Z AUTO 14004KT 10SM CLR 03/M04 A3018
VFR   KHVN 051153Z      25006KT 10SM CLR 04/M03 A3018
VFR   KHWV 051156Z AUTO 25005KT 10SM CLR 05/M02 A3022
VFR   KOXC 051152Z      28007KT 10SM SKC 02/M06 A3017
VFR   KISP 051156Z      25005KT 10SM SCT250 05/M02 A3020
VFR   KBDR 051152Z      24005KT 10SM CLR 04/M03 A3020
VFR   KDXR 051153Z      24007KT 10SM CLR 02/M06 A3019
VFR   KALB 051151Z      28018G26KT 10SM FEW040 02/M11 A3016
VFR   KHPN 051156Z      26006KT 10SM CLR 04/M06 A3019
VFR   KJFK 051151Z      25014KT 10SM SCT250 07/M04 A3023
VFR   KLGA 051151Z      25009KT 10SM FEW070 SCT160 SCT200 BKN250
                     08/M07 A3022
VFR   KNYC 051151Z AUTO 27007KT 230V300 10SM CLR 06/M07 A3024
VFR   KSWF 051145Z      00000KT 20SM SKC 02/M03 A3019
The observation at Stewart (KSWF) was taken by a live person, whereas the ones above were generated by automated equipment. The automated equipment can't measure visibility clearer than 10 miles, or clouds above 12,000 feet. Stewart has a 20-mile visibility marker, and the fact that the sky really is clear is indicated by the abbreviation SKC. CLR means that all clouds are above the measurement limits of the AWOS or ASOS equipment.
VFR   KTEB 051151Z      00000KT 10SM CLR 04/M05 A3022
VFR   KEWR 051151Z      24011KT 10SM BKN250 06/M06 A3023
VFR   KMGJ 051154Z AUTO 26006KT 10SM CLR 03/M03 A3019
VFR   KCDW 051153Z      00000KT 10SM CLR 04/M07 A3022
VFR   KMMU 051145Z      26005KT 15SM SCT250 04/M05 A3022
VFR   KFWN 051153Z AUTO 23003KT 10SM CLR M01/M04 A3022
VFR   KACY 051154Z      24008KT 10SM CLR 07/M03 A3026
      K12N 051154Z AUTO 00000KT 01/M01 A3021
VFR   KMPO 051153Z AUTO 30007KT 10SM CLR 02/M07 A3015
VFR   KABE 051151Z      00000KT 10SM FEW075 04/M04 A3022
VFR   KAVP 051154Z AUTO 00000KT 10SM OVC060 03/M04 A3020
VFR   KHZL 051215Z AUTO 00000KT 10SM OVC048 02/M03 A3019
VFR   KSEG 051153Z AUTO 00000KT 10SM SCT070 M01/M02 A3021


    ********  Terminal Forecasts  ********
Passing
 Time
1200Z    VFR  TAF KBDR 051135Z 0512/0612 25008KT P6SM FEW080
+60min > VFR       FM051300 25010G17KT P6SM SCT080
         VFR       FM051800 24016G24KT P6SM SCT050 BKN080
         VFR       FM052200 35007KT P6SM BKN050
         VFR       FM060000 VRB03KT P6SM BKN080
1200Z    VFR  TAF KISP 051135Z 0512/0612 25010KT P6SM FEW080
+60min > VFR       FM051300 25011G18KT P6SM SCT080
         VFR       FM051800 24016G24KT P6SM SCT050 BKN080
         VFR       FM052200 24011KT P6SM SCT050 BKN080
         VFR       FM060000 VRB03KT P6SM BKN080
1216Z    VFR  TAF KHPN 051135Z 0512/0612 26008KT P6SM FEW080
         VFR       FM051600 26010G17KT P6SM SCT080
         VFR       FM051800 27016G24KT P6SM SCT050 BKN080
         VFR       FM052100 31009KT P6SM BKN050
         VFR       FM060000 VRB03KT P6SM BKN080 AMD NOT SKED
1221Z    VFR  TAF KLGA 051135Z 0512/0612 25011KT P6SM FEW080
         VFR       FM051600 24012G19KT P6SM SCT080
         VFR       FM051800 24018G29KT P6SM SCT050 BKN080
         VFR       FM052200 26012KT P6SM SCT050 BKN080
         VFR       FM060000 VRB04KT P6SM BKN080
1225Z    VFR  TAF KSWF 051135Z 0512/0618 26008KT P6SM FEW080
         VFR       FM051600 27012G17KT P6SM BKN050
         MVFR      FM051800 27009KT 6SM -RA BKN025 OVC050
         MVFR      FM052000 36009KT 6SM -RA BKN025 OVC040
         VFR       FM060000 VRB03KT P6SM BKN080
         VFR       FM061200 11005KT P6SM SKC AMD NOT SKED
1225Z    VFR  TAF KTEB 051135Z 0512/0612 24006KT P6SM FEW080
         VFR       FM051600 25009G17KT P6SM SCT080
         VFR       FM051800 25016G27KT P6SM SCT050 BKN080
         VFR       FM052200 25012KT P6SM SCT050 BKN080
         VFR       FM060000 VRB03KT P6SM BKN080
1228Z    VFR  TAF KEWR 051135Z 0512/0618 25011KT P6SM FEW080
         VFR       FM051600 25011G18KT P6SM SCT080
         VFR       FM051800 25018G29KT P6SM SCT050 BKN080
         VFR       FM052300 26012KT P6SM SCT050 BKN080
         VFR       FM060000 21007KT P6SM BKN080
         VFR       FM060600 VRB04KT P6SM SCT120
         VFR       FM061200 13005KT P6SM SKC
1303Z    VFR  TAF KABE 051126Z 0512/0612 24008KT P6SM SCT100
         VFR       FM051400 25010G20KT P6SM SCT050 BKN150
         VFR       FM051600 25020G30KT P6SM BKN050
         VFR       FM052300 22008KT P6SM FEW050 BKN100
         VFR       FM060200 22003KT P6SM BKN100
1309Z    VFR  TAF KAVP 051137Z 0512/0612 26007KT P6SM FEW060
         VFR       FM051700 26013G26KT P6SM OVC040
	               TEMPO 0518/0522 -SHRA
         VFR       FM052300 23005KT P6SM SCT040 BKN100
         VFR       FM060200 VRB03KT P6SM SCT060 BKN150

    ********  Winds Aloft  ********
050600Z
0800-1500Z
      030    045    060        065       085      090       120
            Filed            Filed+2k  Filed+4k
JFK 300023 295030 290037-07 292040-08 299050-12 300052-13 300056-17
AVP 310015 295029 280043-06 282045-07 289054-12 290056-13 300061-18


    ********  NOTAMs  ********

    ********  Aerodrome NOTAMs  ********
!IPT 02/099 N13 AD ABN OUT OF SERVICE 1502101343-PERM

    ********  Service NOTAMs  ********
!AOO 09/147 PSB SVC AUTOMATED WEATHER BROADCAST SYSTEM OUT OF
SERVICE 1409161157-PERM

    ********  UAS Operating Area  ********
UAS Operating Area DEFINED AS 5NM RADIUS OF 405200N0725100W
(2.8NM NNE HWV) SFC–680FT (SFC–400FT AGL) WED THU FRI MON TUE
SR–SS 1406060920–1506060019.
We get the bad news first. The briefing begins with Adverse Conditions, including NOTAMs for closed or unsafe airports and temporary flight restrictions (TFR). Years ago, TFRs were issued mainly to protect firefighters and accident investigators. Now, the most common use of this device is to keep us from flying too close to politicians, Disneyland, or NASCAR races and ball games. Seriously.
SIGMETs and AIRMETs are in this section, as well as Urgent Pilot Reports (UUA). These reports use the familiar two-letter USPS abbreviations for states, plus five more for each of the Great Lakes: LS LM LH LE LO.
The Synopsis follows. This is a link to the current Surface Analysis chart.
Formerly, the Standard Briefing included an Area Forecast, but this section has been discontinued. Pilots are now referred to NOAA's Graphical Forecast (GFA) Tool. This tool shows the results of a computer model, whereas the old area forecast was compiled by meteorologists. At this writing (2018), it's still evolving.
Surface Observations (METAR, METeorology Aviation Routine) are coded in
the same order as a typical ATIS broadcast. Consider the report for
Bridgeport:
VFR KBDR 051152Z 24005KT 10SM CLR 04/M03 A3020
Here's how this is decoded.
KBDR 051152Z 24005KT 10SM CLR 04/M03 A3020
"Bridgeport airport information Xray, 1152Z observation. Wind 250 at 5,
visibility 10 miles, sky clear below 12,000. Temperature 4, dewpoint minus
3, altimeter 30.20. [ active runway and local NOTAMs ] Advise on
initial contact you have information Xray."
"wind 250" is not a mistake. The operator has added ten degrees to adjust for local magnetic variation. In general, this correction is applied to anything said on the radio. In standard weather reports, the reference is to True North. "If you read it, it's True; if you hear it, it's Magnetic."
Terminal Forecasts (TAF, Terminal Aerodrome Forecast) are coded much like METARS, but they need to include the element of time. Again, let's look at the report for Bridgeport.
1200Z    VFR  TAF KBDR 051135Z 0512/0612 25008KT P6SM FEW080
+60min > VFR       FM051300 25010G17KT P6SM SCT080
         VFR       FM051800 24016G24KT P6SM SCT050 BKN080
         VFR       FM052200 35007KT P6SM BKN050
         VFR       FM060000 VRB03KT P6SM BKN080
1912Z    MVFR TAF KCGX 051135Z 0512/0612 09005KT P6SM OVC025
         MVFR      TEMPO 0512/0516 OVC015
         VFR       FM051600 11008KT P6SM OVC030
         MVFR      TEMPO 0516/0518 OVC015
         MVFR      FM051800 12008KT P6SM VCSH OVC015
         MVFR      FM052100 13008KT 4SM SHRA VCTS OVC015CB
         IFR       FM060600 20007KT 5SM BR VCSH OVC007 =
Some of the symbols are familiar, but there are a few new ones:
Forecast winds aloft use almost the same format as METARs and TAFs, but with six digits instead of five, to accommodate speeds over 100 knots. The forecasts begin at 3000 feet above sea level and continue every 3000 feet until a lot higher than we can climb in 120-knot airplanes. For JFK at 3000, the forecast group is 300023. This means from 300° at 23 knots. The last two digits in the groups at 6000 and up are forecast temperature. for JFK at 6000, 290037-07 means wind from 290° at 37 knots, temperature -7°C. The temperatures are interesting to instrument pilots, who would like to avoid icing in the clouds.
For a complete list of METAR and TAF abbreviations, see the NOAA or Coast Guard sites. There is a thorough breakdown at this site for gamers.
NOTAMs (NOtices To AirMen) are grouped into several classifications, to make it easier to find the information we need. For instance, the large set of Obstruction NOTAMs is interesting to balloon pilots, but not so much to us. The two NOTAMs in the box above refer to our destination airport, N13, and another airport nearby at Phillipsburg (PSB). At Bloomsburg, the airport beacon (ABN) isn't working. That won't be a concern, as we plan to arrive in daylight. At Phillipsburg, the automated weather equipment is apparently on the fritz. We weren't planning to use it, but it's nice to know about the problem if we should need to divert there.
The final group of NOTAMs in the briefing is usually the longest, FDC (Flight Data Center) NOTAMs. These are regulatory, not just advice to pilots. This is where IFR pilots find temporary changes to airways and instrument approaches.
With the weather briefing at hand, we now have enough information to finish planning the flight.`
At this point, it's necessary to understand density altitude. For any particular altitude, there are not always the same number of air molecules in a given volume. If the barometric pressure is higher or lower than normal, there will be more or fewer molecules. Same thing with temperature. Humidity also has an effect, although it is surprisingly small. Because so many things about aircraft performance depend on the density of the medium, we work with the concept of density altitude, comparing the situation to a standard condition. We might say that density altitude is the standard altitude where the airplane "thinks" it's operating.
In aviation, we work with the notion of a standard day at sea level. This defines a basis for our calculations. Atmospheric parameters for a standard day are
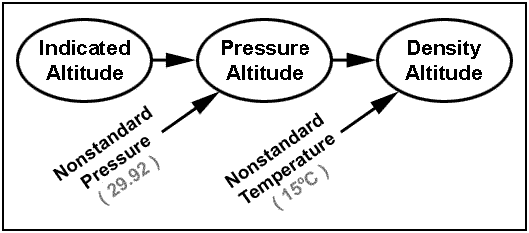
If the temperature or pressure are not standard, neither is the air density. We operate on these parameters to convert the actual altitude to the altitude is would be, if the conditions were standard. Fortunately, this isn't as complicated as it sounds. Let's take it in two steps.
If we set our altimeter for standard pressure (29.92), it will read a value known as pressure altitude. That is, pressure altitude is the indicated altitude that has been corrected for nonstandard pressure. If we further correct this value for nonstandard temperature, the result is density altitude. This is summarized in this drawing:
For our flight, we've planned to fly at 4500 feet. What would the density altitude be? For altitudes below about 15,000 feet, we can derive the density altitude on the ground and simply add a correction. That is, we'll find our density altitude at an airport, get the difference from standard conditions, and apply this to our 4500-foot cruising altitude.
From our weather briefing, we have the condition at BDR, which is nine feet above sea level: temperature 4°C, altimeter 30.20. There are many ways to derive density altitude from this. For the sake of simplicity, just plug them into this density altitude computer. Push the button and read the result: DA = -1644, or 1644 feet below sea level. That is, 1654 feet below the reporting station. (The air is denser than standard.) Apply the same difference to our cruising altitude, and we find that our cruising density altitude will be 2846 feet.
 Now, take a look at the cruise performance charts from the Pilot's Operating
Handbook. In our example (for a Grumman Tiger), we find three column groups,
based on temperature and pressure altitude. The temperature in the
center group is the standard temperature for that pressure altitude. In
other words, the center group has the performance data for the density
altitude in the header. For this airplane, there is no need to ever use the
outer two column groups. Just work out the density altitude and use the
center group.
For our flight, density altitude will be 2846 feet, so we'll use the performance figures for 3000 feet, the nearest supplied altitude. We could interpolate between 2000 and 3000 feet, but it's not worth the trouble for the small amount of added precision. We have a choice to make, and we will choose to operate at 2500 RPM. This will produce 70% of rated horsepower, a value that allows us to lean the fuel-air mixture for efficient operation. We now know two important operating parameters.
Write 10.2 in the spot marked
We now have enough information to work out estimates for heading and groundspeed, based on the forecast wind at our altitude. As noted earlier, we'll use the Kennedy (JFK) forecasts for part of the trip, switching to the forecast for Wilkes-Barre (AVP) after our route crosses the Delaware River. Our cruising altitude is halfway between two forecast altitudes. So we'll interpolate, or split the difference.
Most briefing sources do the interpolation for you, if specified an cruising altitude that's not one of the standard ones. They also calculate winds at 2000 and 4000 feet above and below that altitude, so you can "shop" for a better groundspeed. Some tools, like NOAA's Winds/Temps Forecast tool, only give the forecasts at standard altitudes. If you use a tool like this, you'll need to do the interpolation yourself. Interpolate both the direction and speed of the wind. The values from the winds-aloft forecast, and the interpolated results, are
| 3000' | 4500' | 6000' | |
| JFK | 300° @ 23 | 295° @ 30 | 290° @ 37 |
| AVP | 310° @ 15 | 295° @ 29 | 280° @ 43 |
For cruising altitudes like 3500, 5500, 6500, etc., don't bother interpolating the winds-aloft forecast. Just use the column that's only 500 feet away from your altitude. You can see from the +2K and +4k calculations in the forecast that the small error won't affect your estimated groundspeed very much.
To understand how to estimate the heading that will keep us on course, and the speed we'll make good over the ground, we need to delve into a bit of vector algebra. If there's any wind at all, it usually pushes the airplane somewhere we don't want it to go. That's the case for this trip. Let's take a look at the part of the trip between the Hudson and Delaware Rivers. We want to track 265° over the ground, but the wind is blowing from 295° at 30 knots. That's expressed in the diagram that follows. The meaning of the vectors' direction is obvious. Their lengths represent speed. We could actually construct this diagram with a protractor and a ruler, and measure our unknowns graphically.
Draw the green line first, to represent our ground track. The only thing we know so far is that it must be oriented 265°. We don't know how long to make it yet. When we're done, its length will represent our groundspeed. For now, just guess and make it long enough. We can see that we'll have a headwind, so we know it will be less than our airspeed — scaled for 120 knots or so should be ample. At one end of that line, draw a vector for the wind. This is oriented 295° and should be scaled to represent 30 knots.

Now put your scale at the beginning of the wind vector and orient it so it touches the groundspeed vector at a place where the airspeed represents 128 knots. It's only possible to draw one triangle that satisfies this stricture. This is the wind triangle for this part of our trip. It represents the fact that we have to turn the airplane a bit to counter the effect of the wind and stay on track. We can measure the exact angle, 7°. We can also measure the length of the groundspeed vector now: 101 knots. Practice sketching these triangles until the concept sinks in. You don't need to be accurate, because we have much better tools for this job. But if you can sketch a wind triangle, you will know qualitatively if you have a headwind or tailwind, and which way you have to turn to compensate for the crosswind component. This will back up the more accurate calculation, preventing silly mistakes.

There are several ways to solve the wind problem without resorting to mechanical drawing. Classically, pilots used a mechanical flight computer such as the E6B. Now we have electronic flight computers like Sportys E6B or the ASA CX-2, or computer programs, for that task. The E6B seems a little out of date, but it still works, and has even been used for intergalactic travel. One example should be enough to explain how to use this simple tool. You'll probably prefer other methods, but the example will help you understand that the E6B is nothing more than a mechanical aid to solve a problem in vector analysis.
At the beginning, the wind vector is the only one for which we know both direction and amplitude, so we must mark that one on the flight computer first. Move the slide so 100 knots is under the "grommet," or center of the translucent dial. Then turn the wheel to place 295° (wind direction) against the true north arrow. Make a mark at 130 knots, or 30 knots from the center. This dot represents the tail of the wind vector. Mark a small dot and circle it, so your measurement will be accurate but easy to find.
Now turn the wheel to the ground track, 265°. We don't know the groundspeed yet, but we're about to figure it out. That dot represents the tail of the wind vector. It also represents the head of the airspeed vector, and that's a value that we do know. Move the E6B slide so the dot lines up with 128 knots and the problem is solved. Notice that the E6B is an exact replica of the wind triangle above.

Click the image to see whole face of the flight computer.
 The center of the dial represents the head of both the wind and the
groundspeed vectors. It now lies over the groundspeed value, 101 knots. The
dot is 7° off center, representing the wind correction angle. It's
to the right of center, so we'll add 7° to the true course to find the
true heading (th).
Enter these numbers in the center column (Croton Point to
Delaware River), left side of the navigation log:
wca and gs.
Add the magnetic variation
to find the required heading that should keep us on course
(mh).
Repeat this whole process for the segments
If you use an electronic flight computer, it will not display the wind correction angle, but you don't care — it supplies the true heading directly, so you can skip one small step in the description you just read. You may also realize that you can use the mechanical E6B to enter magnetic course instead of true course. That handles the variation automatically. The technique usually only confuses pilots, so I'll just mention it once and then drop it. Consider it "advanced flight school, World War II style."
Knowing the groundspeed over our course, we are finally ready to estimate how long it will take to fly the trip. We're about to complete the est time column on the navigation log. First, we need to deal with two fudge factors.
Your flight begins on the ground, not at cruise altitude. The first part of it will be somewhat slower than the cruising speed we worked out earlier. Obviously, this will add some time to the trip. We need to account for this.
 Many flight schools will have you begin your tour of the POH performance
section by working out a Top of Climb, and use it for your first waypoint. I
disagree with this practice, for a lot of reasons — mostly because it
adds complexity to a process that's already more complicated than it needs to
be. To find Top of Climb, you must do some magic on that graph for your
cruise altitude, do it again on your departure field elevation, and subtract
the results. All this to find an imaginary point that probably has no useful
landmarks to associate with it. Why?
What you really want to know is the time penalty for climbout, which includes something that's not on that graph: if your takeoff runway isn't pointed directly at your destination, you will spend some time flying in a different direction from where you want to go.
If you analyze the climb performance for several airplanes, and compare the time to Top of Climb with the time to cruise the same distance, you can come up with a good rule of thumb. For most of the planes that will be used by anyone still reading this article, each thousand feet of climb costs ½ to one minute for every thousand feet gained, compared to cruising speed. This leads to a useful approximation if you plan your first waypoint outside the top-of-climb radius:
 Add one minute for each 2000 feet between field elevation and cruise
altitude.
Divide the altitude to gain by 2000, and round up any fraction, no matter how
small. Then consider any difference between direction of takeoff and the
course to the first waypoint, and
add some time to account for maneuvering after takeoff. Two or three
extra minutes will usually be enough; accuracy will come with practice.
Add these two estimates and enter the total in the little climb-penalty box
under est time. For this trip, we expect to
depart straight out, so the only penalty will be in the climb from sea level
to 4500 feet:
It's time to use the other side of that E6B flight computer now. You can do this part of the planning with an electronic calculator, but with practice it's actually easier on the old mechanical model[4].
When you use the mechanical E6B, just remember that the inner wheel represents time and the outer scale represents the other parameter you're working with at the moment. ("Time moves.") The units on the inner wheel are minutes. We'll make frequent use of the large pointer on 60 minutes, which is of course one hour.
 For the first part of the trip, groundspeed is 100 knots. We need estimates
of the time it will take for each segment. Turn the time wheel so the
60-minute pointer lines up with 100 (same as 1, 10, or 1000 — you have
to keep track of the decimal point). That is, in 60 minutes we will
travel 100 nautical miles. This establishes a proportion that will be valid
for all segments with this groundspeed. On the outer (mileage) scale, find
the length of the first segment, 19 miles. Setting the decimal point
somewhere sensible, we see that it will take 11.3 minutes to travel this
distance at 100 nautical miles per hour. Round that off to 11 minutes and
enter it in the first block of
est time, below the 3-minute climb penalty.
For this one cell only, add the numbers and enter the 14 minutes it should
take to reach the first waypoint, accounting for maneuvering and climbout.
For all other segments, just read the times that correspond to segment length, round to the nearest minute, and enter the segment time in the appropriate cell on the navigation log. For this trip, we need to make two trivial adjustments to groundspeed as the trip progresses westbound.
When you practice landings in closed traffic, you can usually get one circuit every five minutes if there's no other traffic in the pattern. This should be the longest time you need to add to your arrival at the destination. If you approach straight in, but enter on the upwind leg, you'll need one full trip in the pattern between arrival and landing. Five minutes. All other entries will add somewhat less: direct downwind entry should add 2½ minutes, and other entries are also something less than five minutes extra. If you have the good luck to arrive in line with the runway, and the confidence to land straight in, you might still add a minute to maneuver for landing because you'll have to slow down on final. Obviously, you'll estimate this time based on anticipated pattern entry. Whatever it is, add a few minutes in the nav log's est time column and make a notation that it's for maneuvering in the pattern.
For this trip, we expect to arrive fairly well lined up on the runway, but it's an airport we've never seen before. Rather than land straight-in, we'll plan for an upwind entry: one full circuit in the landing pattern. Therefore, we'll add 5 minutes for the pattern, as you see on the nav log below.
Add all the numbers in the est time column and convert the result to hours and minutes. For example, you would record a 97-minute flight as "1+37" or "1:37." Enter this time in the Time Enroute (Total EET) block of the flight plan, using four digits: 0137.
We need to know how long the fuel load will keep our airplane flying. We've worked out that the engine will burn 10.2 gallons per hour at our chosen power setting, and we know that the airplane carries 51 gallons of usable fuel. How long will that last?
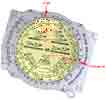 The inner E6B wheel still represents time in minutes, but the outer scale now
corresponds to gallons of fuel. Since we'll burn 10.2 gallons in one hour,
set the 60-minute marker against 10.2 as shown. Now, notice that 51 gallons
matches 296 minutes. Not a very convenient piece of information, on its
face. Take a second look at the (inner) time scale, and find the other scale
inside it: whereas the main scale is in minutes, the third scale transforms
the number to hours and minutes, which simplifies our math. 296
minutes obviously lies between 4:50 and 5:00 on this scale, so we recognize
that 51 gallons of fuel will last 4 hours 56 minutes at our planned burn
rate. In theory, we'd split this equally between our two fuel tanks (Grumman
Tiger).
Just as we need to account for maneuvering and climb for travel time, we also need to make an allowance for fuel burn. Similar analysis reveals that a good rule of thumb is to subtract 1 (Tiger) to 1.5 (Cheetah) minutes of usable fuel for each 1000 feet of climb. Roughly speaking, our usable fuel is about 5:00 hours. Subtract ten minutes' worth from the first tank we plan to use, and enter the result into the navigation log. Not to put too fine a point on it, we'll estimate 2:20 for one side and 2:30 for the other. You can see this at lower right in the nav log just above. Enter the total, 4+50, on the flight plan.
Finally, we have all the information we need to file the flight plan. If you've been recording it on the standard ICAO form, it should look like the illustration here. If you've been keeping the information current on the Flight Service web application, it's ready to file — just push the button. Otherwise, make the phone call and read the information from your papyrus. Although the route isn't purely Direct, it makes sense to file DCT as a VFR route. Our little dogleg isn't far enough off to make any difference in the area that will be searched if we don't turn up at Bloomsburg on time.
A complete discussion of weight and balance is outside the scope of this article. If your instructor has determined that the plane will be in the C.G. envelope for this trip, he may have decided to defer the topic of weight and balance until later in your syllabus. In that case, it's safe to skip to the next section.
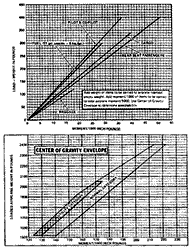 The POH for the Grumman Tiger was written forty years ago, when even
four-function calculators cost a couple hundred dollars. So the helpful
engineers gave us graphs (left) to help work out weight and balance problems
without having to do too much manual number-crunching. We have better
equipment now, and we should use it.
Don't try to enlarge the image of the graphs at left. They aren't much more readable full-size than they are here. It's hard to get accurate results with a graph like this, even with a very sharp pencil.
 The other "helpful" feature introduces even more error: the second graph's
horizontal axis in the POH is moment, not weight.
The envelope is much simpler, and
easier to understand, if it's plotted as a function of C.G. arm and weight,
like the thumbnail at right (click it).
Once you calculate the loaded weight and C.G., just find the point in that
diagram and you can see instantly if you're in the envelope or not. It would
be nice to have this diagram in the POH. It's still worth the effort to
construct it
if you don't have the tools to analyze weight and balance electronically.
For that you need the C.G. limit data, which can be found in a
required part of the
Type Certificate Data Sheet. (You can search for your own TCDS
here.) Once you have the information, calculate your weight and
balance using this form, or one like it for your airplane:
| Weight, pounds | Arm, inches | Moment | |||
| Empty weight incl. oil | 1494 | x | 83.56 | = | 124,834 |
| Front seat | + | x | 90.60 | = | |
| Rear seat | + | x | 126.00 | = | |
| Baggage (120 # max.) | x | 148.00 | = | ||
| ————— | ————— | ————— | |||
| Zero fuel weight | x | = | |||
| Fuel gals (51 max) | x | 94.81 | = | ||
| ————— | ————— | ————— | |||
| Total weight |
x | = |
One feature of this calculation that is also missing from the Grumman POH, is the entry for Zero Fuel Weight. This would be the condition of the airplane if you loaded it for takeoff and got rid of all the usable fuel. This is useful information. because it helps to evaluate how the center of gravity will move during flight as you burn off fuel.
In the example plane, the C.G. for fuel is behind the aft limit of the envelope. This means that
For the intended audience of this article, your plane almost certainly has only one station for fuel (e.g., no tip tanks). Even if you can fly the plane out of C.G. by burning fuel, the progression will be linear. That is, in a tricky case, you can find an amount of fuel where the C.G. crosses the limit of the envelope — usually at the aft edge. For most of us, this will never be a serious concern.
With the planning done and the flight plan filed, it's finally time to go flying. Fold the navigation log so you can use the right side of it in the cockpit. ATIS "Delta" is on the radio, and you might write enough information to remember what you need. In this case, "D 24" is enough to remember the active runway. You adjusted the altimeter while listening to the broadcast, so there's no need to write the number here.
 Every time you enter times in the navigation log, you will be writing two
numbers:
This begins shortly after takeoff. If we break ground at 9:38, we'll write that in the time off box after we get to a safe altitude. Adding 14 minutes for the first segment, we'll also write "52" for our estimate of the time we'll reach the reservoir. Suppose it took an extra minute to do that. At the reservoir, we'd write
 You went to a lot of effort to calculate a heading for wind correction. You
should find out as soon as possible it if works. That means getting on
course, and seeing if the heading is correct. Suppose you took off on runway
24. You'd climb southwest for a couple of miles and turn. If you turn to
291° and your calculation was perfect, you'd fly parallel to your course,
but two miles away, the whole time. That's not how to do it.
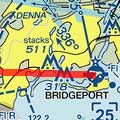
You want to find something right under your course line and fly there as soon as you can. Then turn to your calculated heading, and see if it keeps you on course. Our course line goes over an obstacle set marked "stacks – 511." Being locally based, we know that's the "Candy Stack," a chimney that's painted red and white. (The "318" obstacle set is the WICC antenna.) So we'll make a point of flying to the Candy Stack before turning on course.

That's the view of both obstacle sets from next to runway 29. Click it
for a closer view.
Do your groundspeed check between the reservoir and Croton Point. It goes without saying that this is easy with a GPS; here's how to do it with a stopwatch and E6B. It adds a bit of complexity, but not much. You need to measure the time between the two chosen waypoints. At the reservoir,
 On the E6B, set 9½ minutes on the inner (time) wheel against 16 miles
on the outer wheel, which now represents distance. We note that the 60-minute
mark points to a groundspeed of 100 knots, which is satisfying. But we really
want to know when we'll get to Bloomsburg. This is what the dist rem column is for.
 We know what time it was at Croton Point, and we know how far it is
from Croton Point to Bloomsburg (116 NM). Without moving the wheel on the
E6B, we see that, with our measured groundspeed, it will take 69 minutes
(1:09) to travel 116 NM. Adding that to our time at Croton Point (10:03),
we estimate that we'll get to Bloomsburg at 11:12. Add a few minutes for the
traffic pattern, and we should be on the ground there between 11:15 and
11:20. Here's another look at the nav log as it will look at this point in
the flight.
If you use an electronic flight computer, use its internal timer instead of a stopwatch. Then use the gs function to find the groundspeed, followed by leg time to find the time from Croton Point to Bloomsburg. When you do it in this order, the calculator will supply the correct time and groundspeed when you need them.
Of course, this is a lot easier with a GPS, if you set it up right. The instrument always knows groundspeed, and you can set its flight plan page to show the ETA for each waypoint. If you did that, just look at that page and you've saved yourself a lot of work. But now you know how your grandfather used to do it.
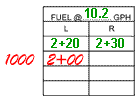 With almost five hours' fuel on board for a flight of less than two hours,
we're not concerned about running dry. But in a low wing airplane, it's a
good idea to switch tanks now and then, even if it's only to maintain roll
balance. If you start out with both tanks full, run the takeoff tank for
half an hour. Then switch to the other tank and run it for an hour. Switch
every hour after that. This way, the tanks are always within half an hour of
each other. Do a little arithmetic and keep track of fuel remaining in the
boxes in the lower right corner of the nav log.
If the first switch isn't on an hour or half hour, there's room to write the
minutes there, to help you keep track of what time to make the next switch.
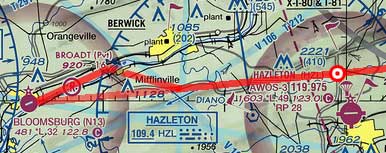
Back when you were planning this trip and sketched that little airport diagram on the nav log, you might have noticed that your approach to the airport was at a bit of an angle to the runway. The easiest way to see an airport is to be lined up on a runway; worst is at right angles. Maybe there's something we can to improve the odds of spotting our destination, at almost no cost. Looking at the chart near Bloomsburg, note that there is a 4-lane highway and a railroad that both lead directly to the airport, and that they are parallel to the runway. You don't really know this from the chart, but that 1085-foot "plant" in Berwick is a large nuclear reactor. You will probably see steam rising from the cooling tower, a hundred miles away. As you pass this place in your descent, turn 20 or 30 degrees right, find the railroad, keep the four-lane on your right side, and proceed to the airport that way. This is not very far out of the way — it probably won't add 30 seconds to your flight, so it won't throw off the navigation timing. Soon you should see a runway, and if the time is right it will be the one you're looking for. You're also set up well for a smooth entry into the pattern, no matter which runway the wind favors.
In the unlikely event that you don't see the airport in time, you should not descend too low — wouldn't want to interfere with the traffic pattern. If you don't see the airport, stop descending 500 feet above the highest traffic pattern altitude. Remember twins and heavy singles. This usually means that you shouldn't descend lower than 2000 feet above the airport unless you can see what you're doing there. That little detour near Berwick set you up for success, so this caution will probably not be needed.
GPS makes light work of all this. Modern GPS units, both in the panel and portable, are so capable and feature-rich that operating one can seem almost as daunting as planning and navigating the old-fashioned way. It doesn't need to be like that.
There are only a few things you really need your GPS to do for you. They're easy to learn for most units, and will keep you on course while you learn some of the fancier features.
 Push this button and you should be presented with a way to spell an airport
identifier, or the name of any other waypoint you'd like to find.
More experienced pilots like to joke with students that they can't take off on a trip until the paperwork weighs as much as the airplane, or until they've spent more time in planning than the trip will take. At first it might seem that way, but like all things it gets easier with practice. The greybeards will also tell you that you'll never need any of these skills after you pass your flight test. They're the guys who either never go anywhere, or get lost when they do. Take the time to understand how to plan your flight, and you can take satisfaction from executing it well. Better yet, you can go where a lot of people can't, and enjoy new and distant places.
Once you get underway, things often change that require enroute adjustments. That's the topic of another article.
Once you have that Private Pilot license, you can take your passengers just about anywhere in the world, if the weather is good enough. This calls for some planning tools that you may not have encountered in primary training, and it calls for some additional knowledge about how to get the most utility out of the destination airport and its surroundings after you've landed and tied down. There's an article for those topics, too.
[1] Vertical speed for 300 ft/nm descent:
[2] This document has been called Chart Supplement for a few years now. But the section that provides data for airports and navigational aids is still called Airport/Facility Directory. This article has kept that name, and the abbreviation AFD, because it is clearer and more descriptive.
[3] The FAA has revised the deadline for domestic ICAO flight plans several times. As of August 2018, the requirement has been postponed indefinitely. But ICAO format is accepted for all flight plans, including domestic.
[4] If you check the E6B calculations with an electronic calculator or a very accurate mechanical flight computer, you'll notice small errors in the illustrations here. These errors are in the device itself: the circular scales are not perfectly accurate. Most mechanical flight computers have these imperfections, some worse than others. The errors are small, and don't affect any important aspect of the results, so I have allowed them to remain.